Traffic deaths due to impaired driving in the Washington region continue to exceed pre-pandemic levels. According to the How Safe Are Our Roads Report, a 31-year-running survey from the Council of Governments (COG) that tracks trends in road safety, 96 people lost their lives to impaired driving in 2022. The region’s current numbers represent a deviation from the rest of the country, which has seen declines in traffic fatalities from pandemic-era highs.
While traffic deaths due to impaired driving increased nearly 13% between 2021-2022, arrests for impaired driving have decreased by 9.3%. Enforcement is part of the picture, with other factors less clear. As regional leaders work to recover from a pandemic that made people afraid to leave their homes for other reasons, let’s take a look at the available data.
“In one aspect, what’s happening locally is a microcosm of what’s happening nationally. During the Covid era, nationally drunk driving fatalities went up by a double-digit in 2020. They went up by another double-digit in 2021. And people were driving dangerously because they could. That includes drunk driving,” said president and CEO of the Washington Regional Alcohol Program (WRAP) Kurt Erickson, the organization that partnered with COG on the traffic survey.
Where are these crashes happening?
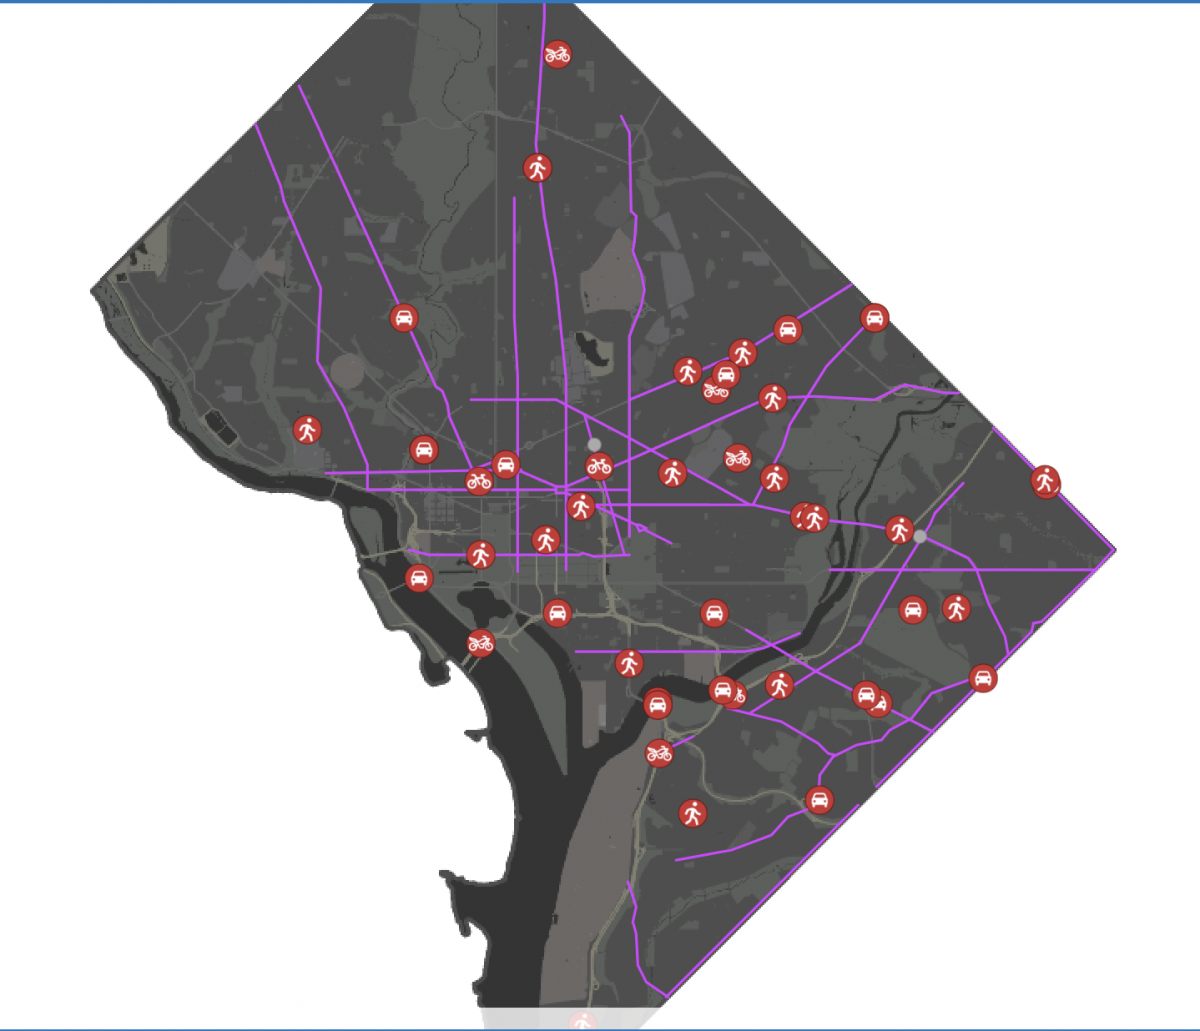
DC’sinteractive Vision Zero map doesn’t separate out traffic fatalities due to impaired driving, but it still shows detailed statistics on fatal crashes. In DC, the majority of crashes happened downtown, Northeast, and Southeast.
Local media investigations have found that traffic deaths in DC are highly concentrated in the city’s less affluent corridors, particularly Ward 7 and Ward 8. Reporting from the Washington Informer found that 40% of DC traffic deaths in 2022 occurred east of the Anacostia River.
Those far-flung western parts of DC past Georgetown, where there’s a lack of mass transit options, saw only a handful of fatalities during the same time period.
In Prince George’s County, a Vision Zero heat map shows aparticularly deadly stretch “that runs from southern Prince George’s County parallel to the Interstate 95 corridor into northeast Baltimore County.” During the period of COG’s study, there were 252 traffic fatalities in the county. Forty-two of those deaths were due to impaired driving.
Fatal crashes in Prince George’s County. Source: Zero Deaths Maryland
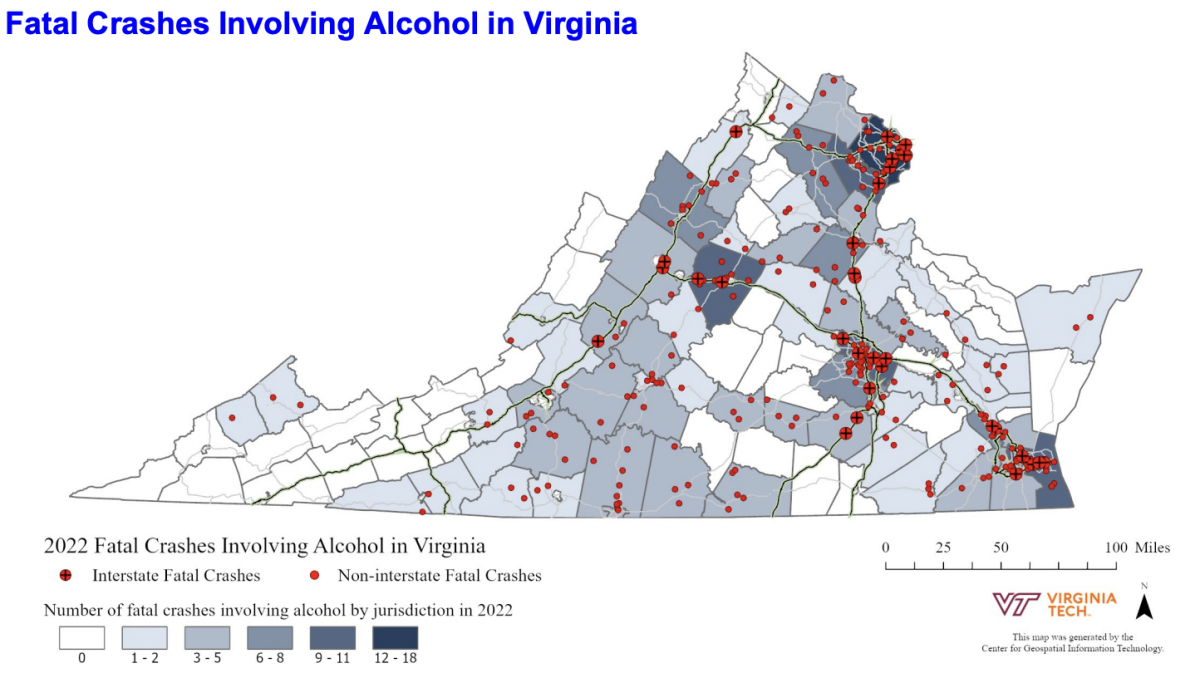
Virginia Traffic Crash Facts, on the other hand, does provide detailed maps of where impaired driving occurred (the map below is from their 2022 report). In Virginia, the bulk of such crashes occurred in population centers, especially in Northern Virginia around DC.
Fatal crashes involving alcohol in Virginia. Source: Virginia Tech Center for Geospatial Information Technology
Staffing woes and less enforcement meant fewer arrests, less deterrence
The Insurance Institute of Highway Safety (IIHS) says enforcement, like sobriety checkpoints, reduces nighttime crash incidents by 21%, a significant decrease. According to the CDC, sobriety checkpoints “increase the perceived likelihood that impaired driving will be identified and penalized, leading to a reduction in impaired driving.”
During a phone interview, Erickson pointed to lower numbers of uniformed officers available to identify drivers under the influence of alcohol or drugs. But a spokesperson for MPD brushed off the staffing shortage as a significant factor in decreased arrests, telling Greater Greater Washington over email that:
“While the Metropolitan Washington Council of Governments data does show that arrests for impaired driving in the region fell 9.3% from 2021 to 2022, their data also breaks that number down by jurisdiction. Alcohol-related traffic arrests in the District of Columbia fell by only 4.78%, a difference of less than 60 arrests.”
The spokesperson referred back to their traffic safety efforts in the latter half of 2023, which she points out have continued into 2024. Those efforts, though detailed in MPD’s Newsroom during the second half of 2023 when MPD acknowledged a “50% increase in traffic fatalities” over the previous year, were missing throughout 2022 and most of 2021. The lack of updates coincides with the lower arrest rates.
A lot of factors can play into why arrests went down. While some observers point to simple staffing numbers, regionally police departments have stated that sworn officers have had to take on more roles and work more hours, which stretches resources more and can lead to burnout.
“The first key parts of enforcement that had frayed by the end of 2022 were the Metropolitan Police Department’s (MPD) clearance and arrest rates. Overall arrests had also fallen significantly; driven partially by a decrease in the number of officers but primarily by a ~44% drop in arrests-per-officer that began during COVID and never recovered.”
‘Joe Friday,’ who runs the DC Crime Facts account, spoke with me over DMs on X (Twitter), suggesting that while staffing is an issue, the drop in arrest rates tells a more accurate story. “A key thing about MPD is that the mostly poorer neighborhoods with more crime have proportionally fewer officers relative to their share of crime. A more significant decrease in arrests-per-officer after 2020 suggests that MPD cut back enforcement the most in those areas,” Friday said.
Friday wrote in December 2023 that the “‘pullback’ in arrests-per-officer” was greater in Wards 5, 7, and 8. “Fewer arrests generally means lower clearance rates and reduced deterrence.”
The Office of the Attorney General for the District of Columbia (OAG) shows 15,412 cases of impaired driving reviewed between 2019-2022. Due to a lack of jurisdiction, evidence, or other reasons, not all were prosecuted. During that same time period, though, prosecution rates stayed flat and relatively high, and ticked up in 2022.
Transit ridership helps, too
Despite the deadly roadways and dangerous drivers, impaired driving is ever so slightly trending down, both nationally and in the District. DC is still below the national average for drunk driving and is not known to be an impaired driving hotspot, possibly because unlike many parts of the country, the DC region has a lot of alternatives to driving. Both rideshare and Metro are effective alternatives to driving while intoxicated.
A lot of people use these alternatives: Metro ridership is up compared to 2022and 2023. Erickson told me their SoberRide program is more popular than ever with 4,546 users last year. One thing that can help is more evening and weekend service hours, such as WMATA’s new 24-hour bus routes. An expectation of enforcement, too, is a key part of the puzzle.
Share
Thanks for reading!
We are reliant on support from readers like you to fund our work. If everyone reading this gave just $5, we could fund the publication for a whole year.
Can you make a one-time or recurring contribution today to keep us going strong?